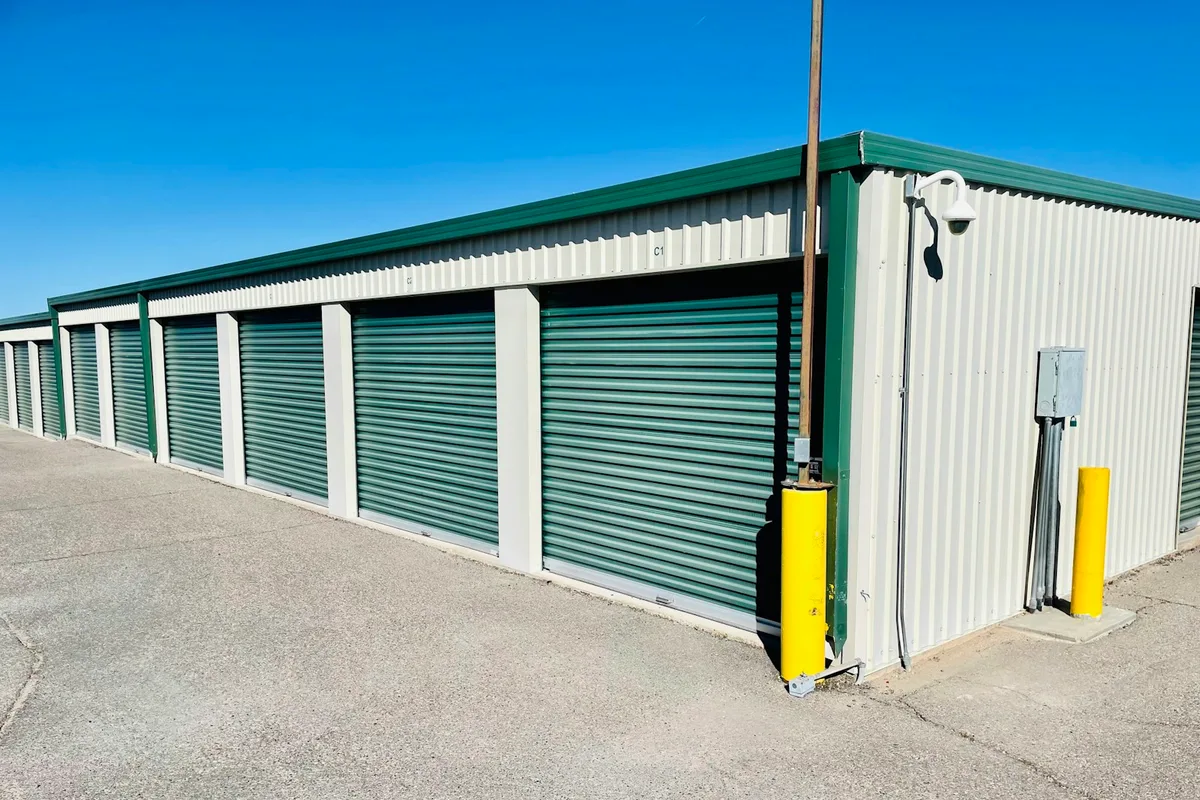
Self-Storage Facility Investment Guide
Self-storage has quietly become one of the most institutionalised specialist commercial asset classes in Australia. Recurring monthly revenue, low operating-cost ratios, deep catchment-level demand, and a repeatable operating template have pulled in institutional capital, REITs, and private investors across every ticket band from $1 million to $100 million plus. For a private buyer weighing a self-storage investment, the stock runs from single-facility owner-operator opportunities through to leased net-lease arrangements with national operators.
What you are buying splits cleanly into two ownership models, owner-operate and net-lease, and the income and underwriting turn on the operator and the catchment. Both are specific to the sector, and neither behaves like the industrial property they resemble on the ground.
Self-storage looks like industrial property but trades like a niche operating business. The income is a rolling weekly average of hundreds of small customer commitments, not a few long leases, and the underwriting framework has to follow the income.
The Two Ownership Models
Owner-operate freehold
You own the freehold and run the facility, either directly or through a management contract. Revenue flows from individual storage unit rentals to a large number of small customers, so what you hold is part real estate and part operating business.
Net-lease to operator
You own the freehold and lease the entire facility to a national or regional self-storage operator: Storage King, National Storage, Kennards Self Storage, Fort Knox. The operator runs the customer-facing business and the landlord collects rent. This is pure real estate, close to any other long-WALE specialist commercial holding.
The two carry different returns, risks, and operating burdens. Net-lease gives the lower headline yield but the cleanest income stream. Owner-operate gives higher gross yields but demands active management and puts the investor on the hook for operating-business volatility.
1 The Catchment Demand Model
Self-storage demand turns on population density within a 3 to 5 km catchment, household formation rates, the renter mix in that catchment, and the supply of competing facilities. The demand side you can quantify from ABS data. The supply side you can map from operator websites and the council planning register.
Demand drivers
- Population in 3 km catchment. 25,000 to 60,000 people is the typical viable range for a 2,000 to 5,000 square metre facility.
- Household formation. Renters move more often than owners, and a high renter mix drives storage demand.
- Apartment density. Apartment dwellers have less storage space and lower garage allocation, so a high apartment mix lifts storage demand per capita.
- Small business density. Tradespeople, e-commerce sellers, and small businesses use storage for inventory and equipment.
Supply drivers
- Competing facilities. The number of competing facilities within 3 km, and the total square metres of competing supply.
- Approved supply. The council DA register for self-storage applications in the catchment.
- Operator concentration. A catchment dominated by one operator behaves differently to a fragmented one.
2 Facility Economics
Occupancy
Stabilised occupancy in a metro Australian self-storage facility typically sits at 80% to 92% by square metre. Below 75%, the facility is structurally under-occupied or working a thin catchment. Above 95%, it is essentially capacity-constrained and holds rate-card pricing power.
Revenue per available square metre (RevPASM)
The headline economic metric: total revenue divided by available rentable square metres. It compares cleanly across facilities and across operators.
Operating expenses
Direct operating costs (utilities, insurance, security, maintenance, on-site management) typically run 25% to 35% of revenue at stabilised occupancy. Indirect costs (head office, marketing, technology) add another 5% to 10% for operators carrying a national network.
NOI margin
Stabilised NOI margins of 55% to 70% are achievable on well-positioned facilities at full occupancy. Anything lower reflects higher OpEx, lower revenue per square metre, or both.
3 The Operator Tiers
National operators
Kennards Self Storage, Storage King, National Storage (NSR, ASX-listed), Fort Knox. National scale, technology platforms, brand recognition, and consistent operating standards. Net-lease facilities held by national operators are the institutional-grade segment.
Regional operators
State-level or capital-city operators running 5 to 30 facilities. Strong local market knowledge, with less technology infrastructure than their national peers.
Owner-operators
Single-facility or two-facility owner-operators. Direct customer relationships and, in some cases, lower OpEx ratios, but exposed to operating-business risk the moment the owner sells.
4 Building Specification
Modern self-storage facilities are climate-controlled and multi-storey purpose-built, with drive-up unit access on the ground floor and lift-and-trolley access to the upper floors. Older single-storey unit blocks are less efficient on land utilisation but cheaper to build.
Specification drivers
- Unit mix. The right blend of small (3 to 5 square metres), medium (8 to 12 square metres), and large (20 plus square metres) units for the catchment.
- Climate control. Coastal and northern climates reward climate-controlled units; cooler markets are less differentiated.
- Drive-up access. A premium sits on ground-floor drive-up, and it is standard on older single-storey facilities.
- Security. 24/7 surveillance, individual unit alarms, gated access.
5 Buyer-Side DD Steps
- Catchment demand analysis. ABS data, demographic profile, household formation, apartment mix.
- Supply analysis. Competing facilities, approved supply, council DA register.
- Operating financials. 36 months of operating P&L, occupancy trajectory, rate card history.
- Unit mix and pricing. Current mix against catchment demand, rate card against market.
- Facility condition. Independent inspection of structure, security, climate control, lift, parking.
- Operator review. For net-lease, the operator's financials and lease structure. For owner-operate, the management transition plan.
- Planning and zoning. Council consent, special use provisions, expansion potential.
- Comparable sales. Recent self-storage sales by tier and catchment.
6 Yields and Pricing
Net-lease self-storage held by national operators prices at the tighter end of the specialist commercial yield spectrum. Owner-operate facilities trade at wider headline yields that reflect the operating-business risk. What separates the pricing is operator covenant, lease structure, and facility specification.
Frequently Asked Questions
Is self-storage suitable for a passive investor?
Net-lease, yes. Owner-operate, no, unless the investor is committed to running an operating business or appointing third-party management.
What is the typical exit buyer pool?
Net-lease facilities with national operators draw national institutional and family-office buyers. Owner-operate facilities have a narrower pool dominated by operators consolidating.
How does the EV transition affect self-storage?
Minimally. Self-storage demand is driven by household and small-business needs, not by transport sector dynamics. Some operators are installing EV charging at flagship facilities as a customer amenity.
Is self-storage suitable for an SMSF?
Net-lease, yes, subject to the standard SMSF and LRBA rules. Owner-operate is generally unsuitable because it runs as an active business rather than an investment.